ASTM D4318 Atterberg Limits
Atterberg Limits testing plays a foundational role in geotechnical engineering. Liquid Limit (LL), Plastic Limit (PL), and Plasticity Index (PI) values directly influence soil classification, shrink swell potential, settlement analysis, and material suitability decisions.
Most geotechnical and Construction Materials Testing (CMT) labs perform ASTM D4318 early in a project lifecycle. Because these values flow into boring logs, laboratory reports, and final geotechnical recommendations, accuracy and documentation consistency are critical.
This guide explains what ASTM D4318 measures, how Liquid Limit and Plastic Limit tests are performed, common calculation and documentation challenges, and how modern labs streamline Atterberg Limits workflows using Aldoa without spreadsheets or rework.
What Is ASTM D4318?
ASTM D4318 defines the procedures for determining a soil’s Liquid Limit (LL), Plastic Limit (PL), and Plasticity Index (PI). These values are essential for:
- Soil classification
- Shrink swell potential
- Evaluating compressibility
- Determining suitability of material for engineered fill
- Pavement and foundation design
Most geotechnical projects require Atterberg Limits early in design. Because LL and PL directly influence boring logs, laboratory reports, and geotechnical recommendations, accuracy and documentation matter.
Because LL and PL values directly influence engineering decisions and final reports, reliable testing and traceable documentation are essential throughout the project.
Quick Definitions: LL, PL, and PI
Liquid Limit (LL): The moisture content at which a soil transitions from a plastic to a liquid state.
Plastic Limit (PL): The moisture content at which a soil begins to crumble when rolled into threads.
Plasticity Index (PI): The numerical difference between Liquid Limit and Plastic Limit (PI = LL − PL). PI is one of the most important indicators of soil behavior.
Soils with higher PI values tend to be more compressible, moisture sensitive, and susceptible to shrink swell. Low PI soils behave more like granular or non plastic materials. Because PI is derived from two separate tests, consistent calculations and traceability are essential in both lab documentation and final geotechnical reporting.
These values directly influence:
- Site grading decisions
- Foundation recommendations
- Pavement design
- Shrink swell analyses
- Material suitability assessments
Why ASTM D4318 Is Critical for Geotechnical Work
Geotechnical engineers rely on LL, PL, and PI to:
- Select fill materials
- Estimate settlement potential
- Predict seasonal shrink and swell
- Input values into USCS or AASHTO classifications
- Populate boring logs and final geotechnical reports
This means errors or inconsistent documentation slow down design, cause confusion in field operations, and create audit risks. Because these values flow directly into boring logs, lab reports, and design recommendations, even small documentation errors can create downstream delays and rework.
ASTM D4318 Test Procedure (Step by Step)
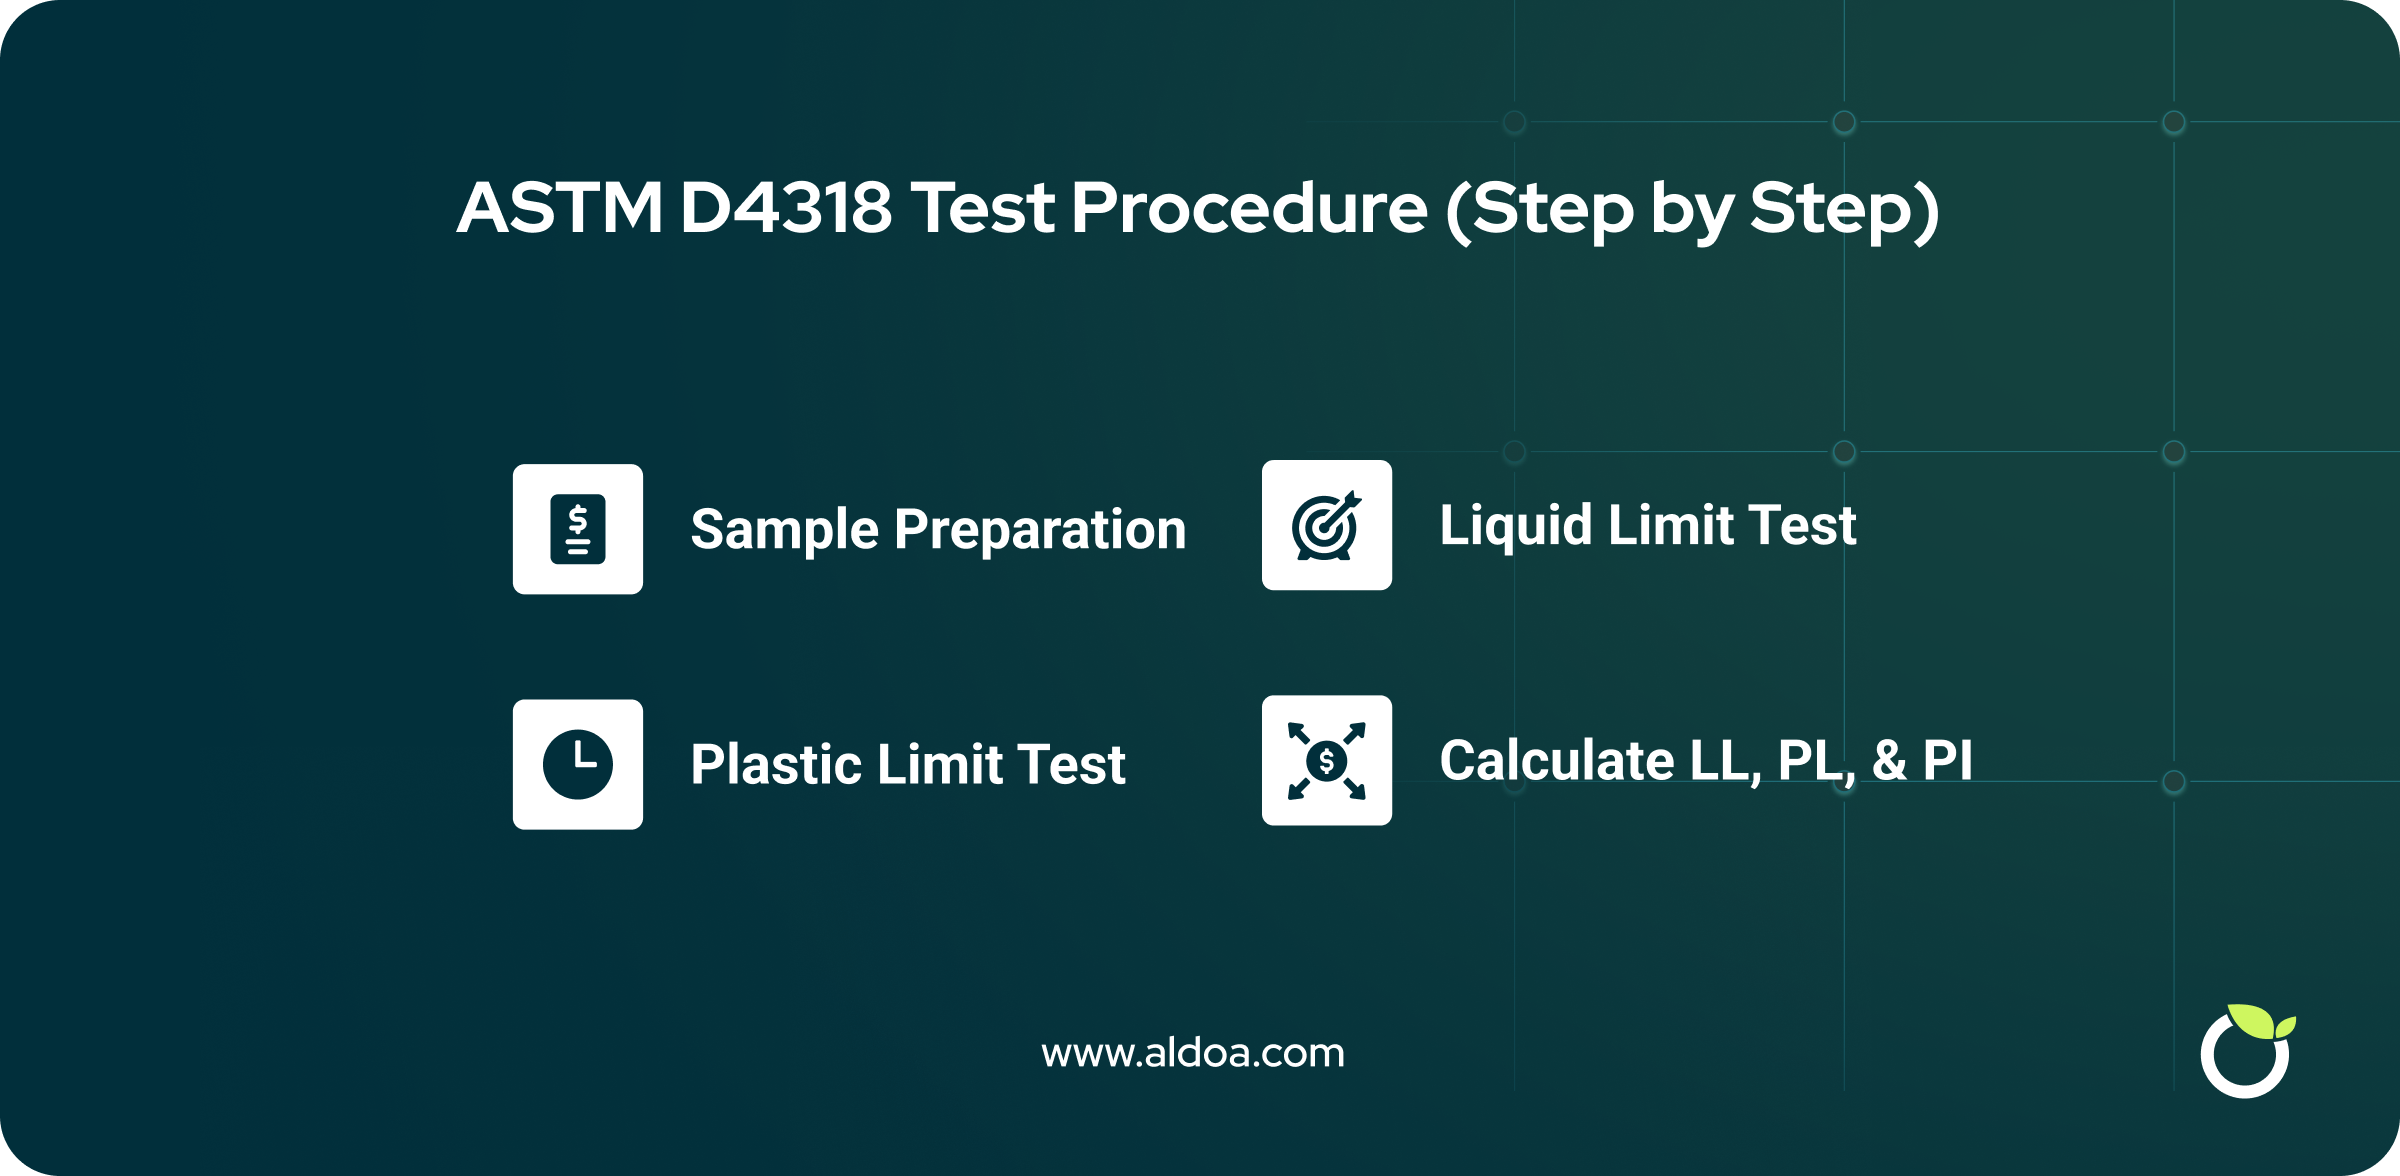
1. Sample Preparation
- Reduce soil to pass No. 40 sieve
- Adjust moisture and mix thoroughly
- Identify containers for LL and PL trials
2. Liquid Limit Test
Performed using fall cone or Casagrande apparatus.
You record:
- Wet soil weight
- Dry soil weight
- Number of blows (Casagrande method)
- Depth of penetration (fall cone method)
Objective: determine the water content at the LL point.
3. Plastic Limit Test
- Roll soil into 3 mm threads
- If threads crumble, record water content
- Repeat and average values
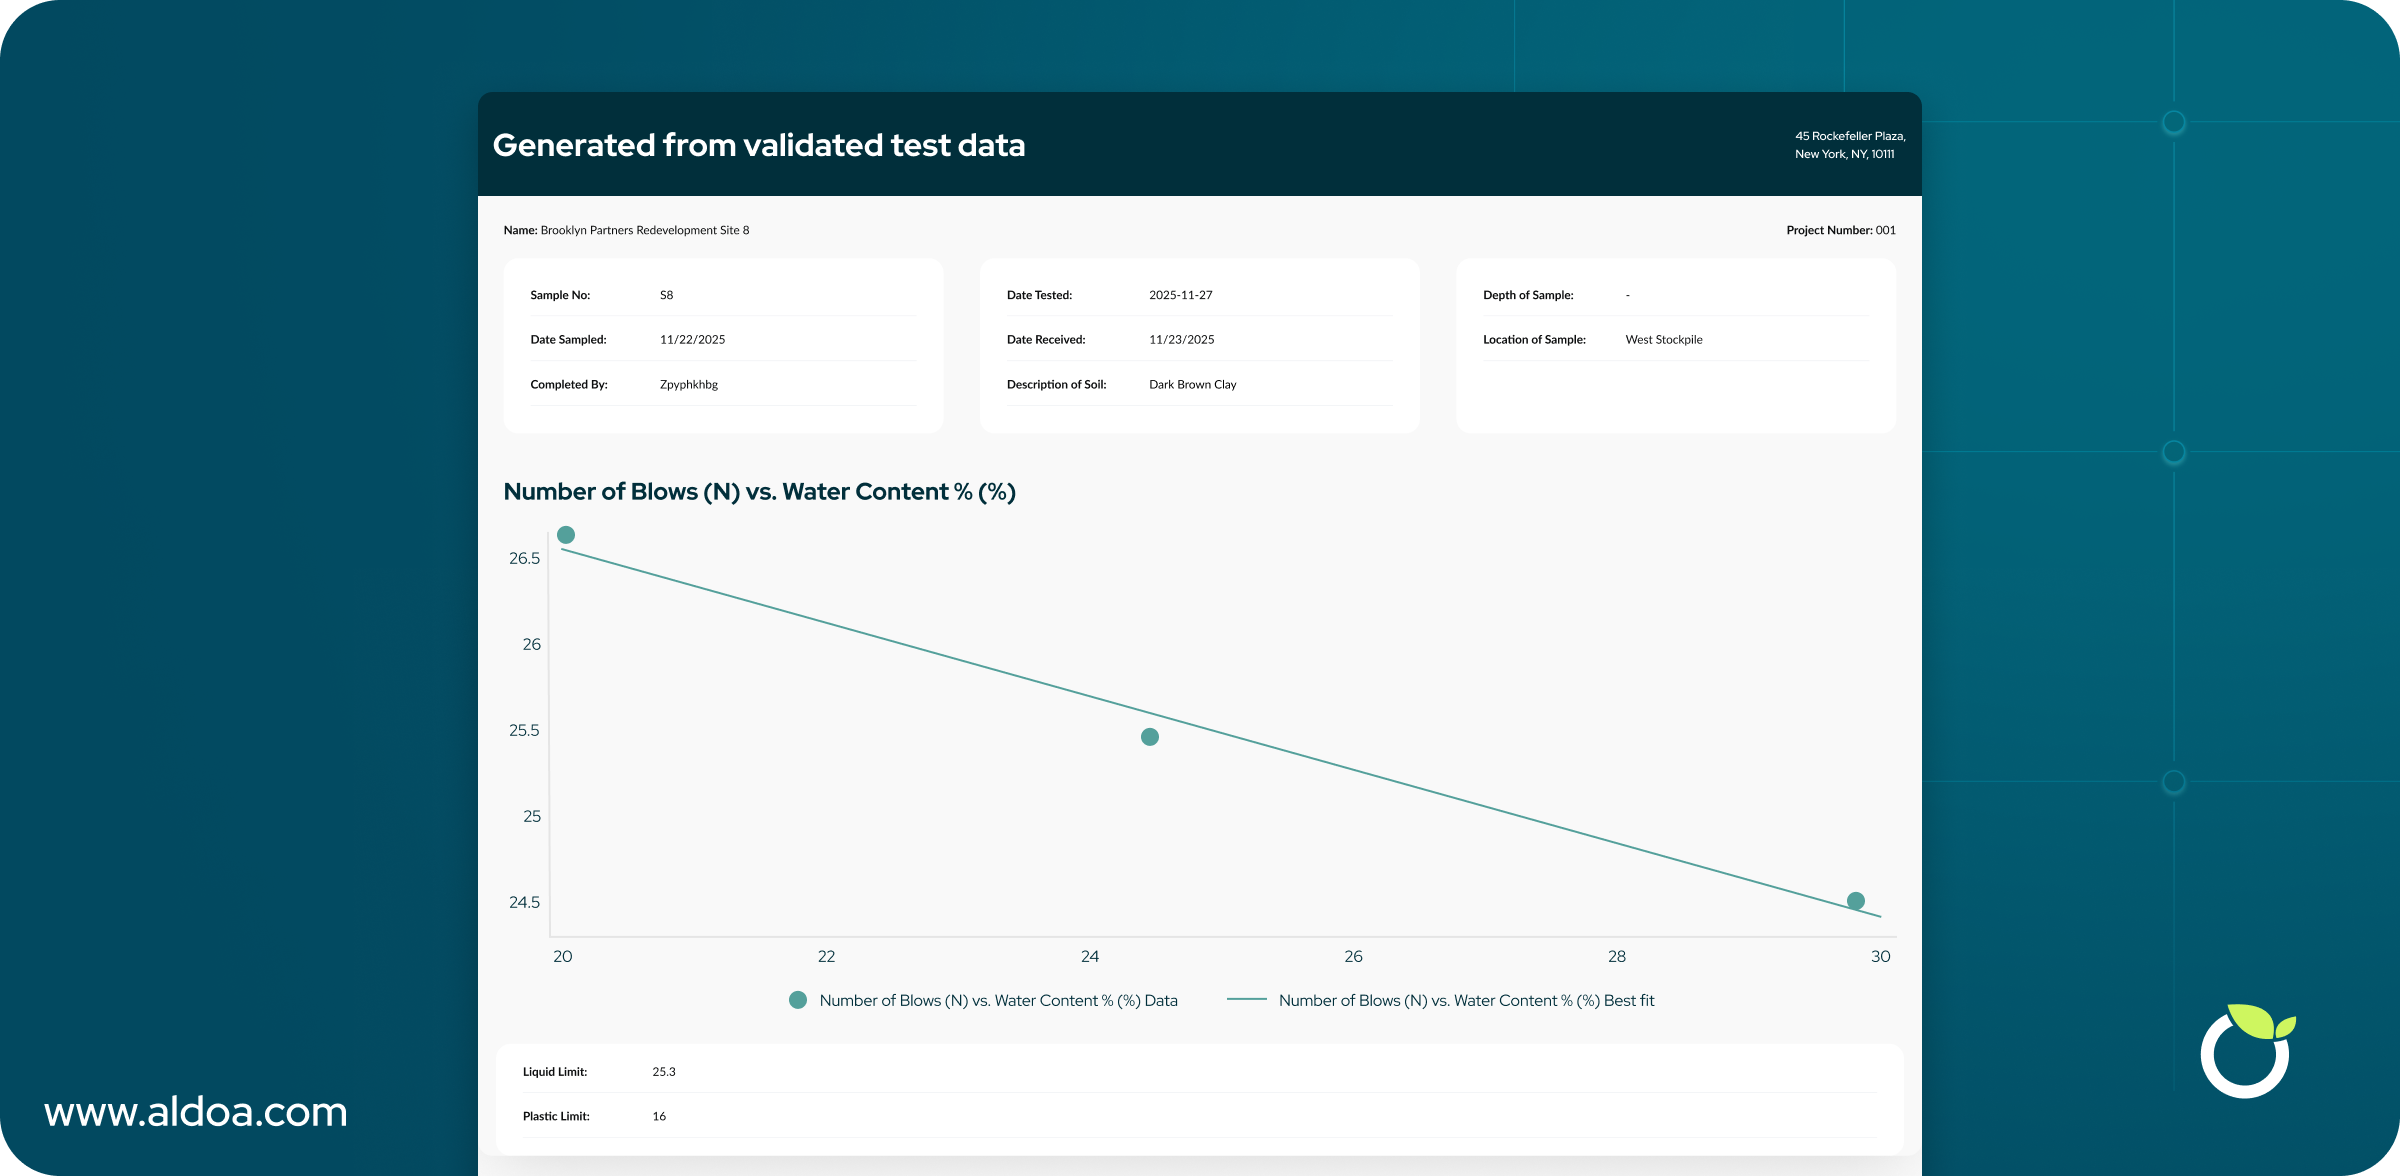
4. Calculate LL, PL, and PI
- Moisture content calculations
- Plot LL curve (if using Casagrande)
- Compute PI = LL - PL
These values feed into classification and design workflows.
While the test itself is straightforward, managing multiple samples, calculations, and documentation across projects is where most labs lose time.
Why Traditional Atterberg Limits Workflows Slow Labs Down
Many labs still rely on disconnected tools and manual processes to run ASTM D4318, which creates delays and inconsistency across projects.
Manual worksheets near ovens
Wet and dry weights are recorded on paper, then transcribed later, increasing the risk of missing data or transcription errors.
Spreadsheet inconsistency
Multiple file versions and varying formulas often lead to inconsistent Plasticity Index calculations and extra verification work.
Lost context between systems
Sample photos, depth information, and boring log references are frequently stored separately from lab results, making traceability difficult.
Without a centralized lab management system, these disconnected workflows slow reporting, complicate reviews, and create unnecessary rework. Aldoa addresses these challenges by connecting field and lab data in a single, standardized platform.
Aldoa’s End to End ASTM D4318 Workflow
Step 1: Field Sample Creation
Field technicians create a sample directly in Aldoa, capturing:
- GPS location
- Depth
- Sample type
- Observations
- Photos
Sample IDs flow directly into project logs, ensuring the lab receives complete context.
Step 2: Lab Receives Sample Data Instantly
Technicians see incoming samples organized by:
- Project
- Required tests
- Priority
- Assigned tech
Supervisors can plan LL and PL testing without guesswork.
Step 3: Digital LL and PL Worksheets
Standardized digital forms ensure every technician uses the same process.
Aldoa automatically computes:
- Moisture contents
- Average LL
- Average PL
- Plasticity Index (PI)
Internal checks flag possible mistakes before approval.
Step 4: Review and Supervisor Approval
Managers can:
- Review moisture calculations
- Validate consistency
- Add notes
- Approve or request edits
Every action is logged for QA and DOT audits.
Step 5: Automatic Reporting and Boring Log Integration
Once test results are approved, Aldoa automatically updates all downstream documentation without manual re-entry. Liquid Limit, Plastic Limit, and Plasticity Index values flow directly into soil classifications, boring logs, and final geotechnical summaries.
By automating technical report generation, labs eliminate duplicate data entry, reduce review cycles, and ensure Atterberg Limits results remain consistent from the original sample through final project deliverables.

Key Benefits of Using Aldoa for Atterberg Limits Testing
- Standardized documentation across all technicians
- Accurate calculations every time
- Complete traceability from sample creation to report delivery
- Faster turnaround for project managers and clients
- Integrated boring logs that eliminate manual entry
- Cleaner workflows between field and lab teams
FAQ: Common Atterberg Limits Questions
What is the difference between LL and PL?
LL is the moisture at which soil behaves like a liquid.
PL is the moisture at which soil crumbles when rolled.
PI = LL - PL.
What method does ASTM D4318 use for LL?
Casagrande cup or fall cone; both are allowed.
Is PI important for design?
Yes. PI influences shrink swell behavior, compressibility, and material suitability.
Does Aldoa support both LL methods?
Yes. Technicians can record Casagrande or fall cone data in standardized digital worksheets.
See How Aldoa Modernizes Atterberg Limits Workflows
See Atterberg Limits Workflow Demo: Schedule Demo
Related ASTM Testing Workflows
Atterberg Limits testing is often performed alongside other laboratory and field tests to fully characterize soil and aggregate behavior. Geotechnical and CMT labs commonly run ASTM D4318 in combination with the following workflows:
-
ASTM D2216 – Moisture Content Used to determine the water content of soil samples, which directly affects Liquid Limit, Plastic Limit, and Plasticity Index calculations.
-
ASTM D1557 – Proctor Compaction Helps evaluate soil compaction characteristics and density, often interpreted alongside Atterberg Limits when assessing material suitability and performance.
-
ASTM C136 – Sieve Analysis Measures particle size distribution and gradation, frequently paired with Atterberg Limits for soil classification and design decisions.
These tests work together to inform soil classification, engineering recommendations, and final geotechnical reporting.
Conclusion
LL, PL, and PI testing should be accurate, consistent, and fast. Aldoa's construction materials testing software unifies field sampling, lab calculations, PI generation, and boring log reporting into a single connected workflow. This reduces errors, speeds up turnaround, and improves visibility across geotechnical teams.
Aldoa gives labs and field teams a modern way to run ASTM D4318 without spreadsheets, manual transcription, or outdated legacy systems.
.svg "Aldoa Assets (3)")